Administrator dashboard
The first screen of the administrator console summarizes what is running within your scope.
As an organization or group administrator
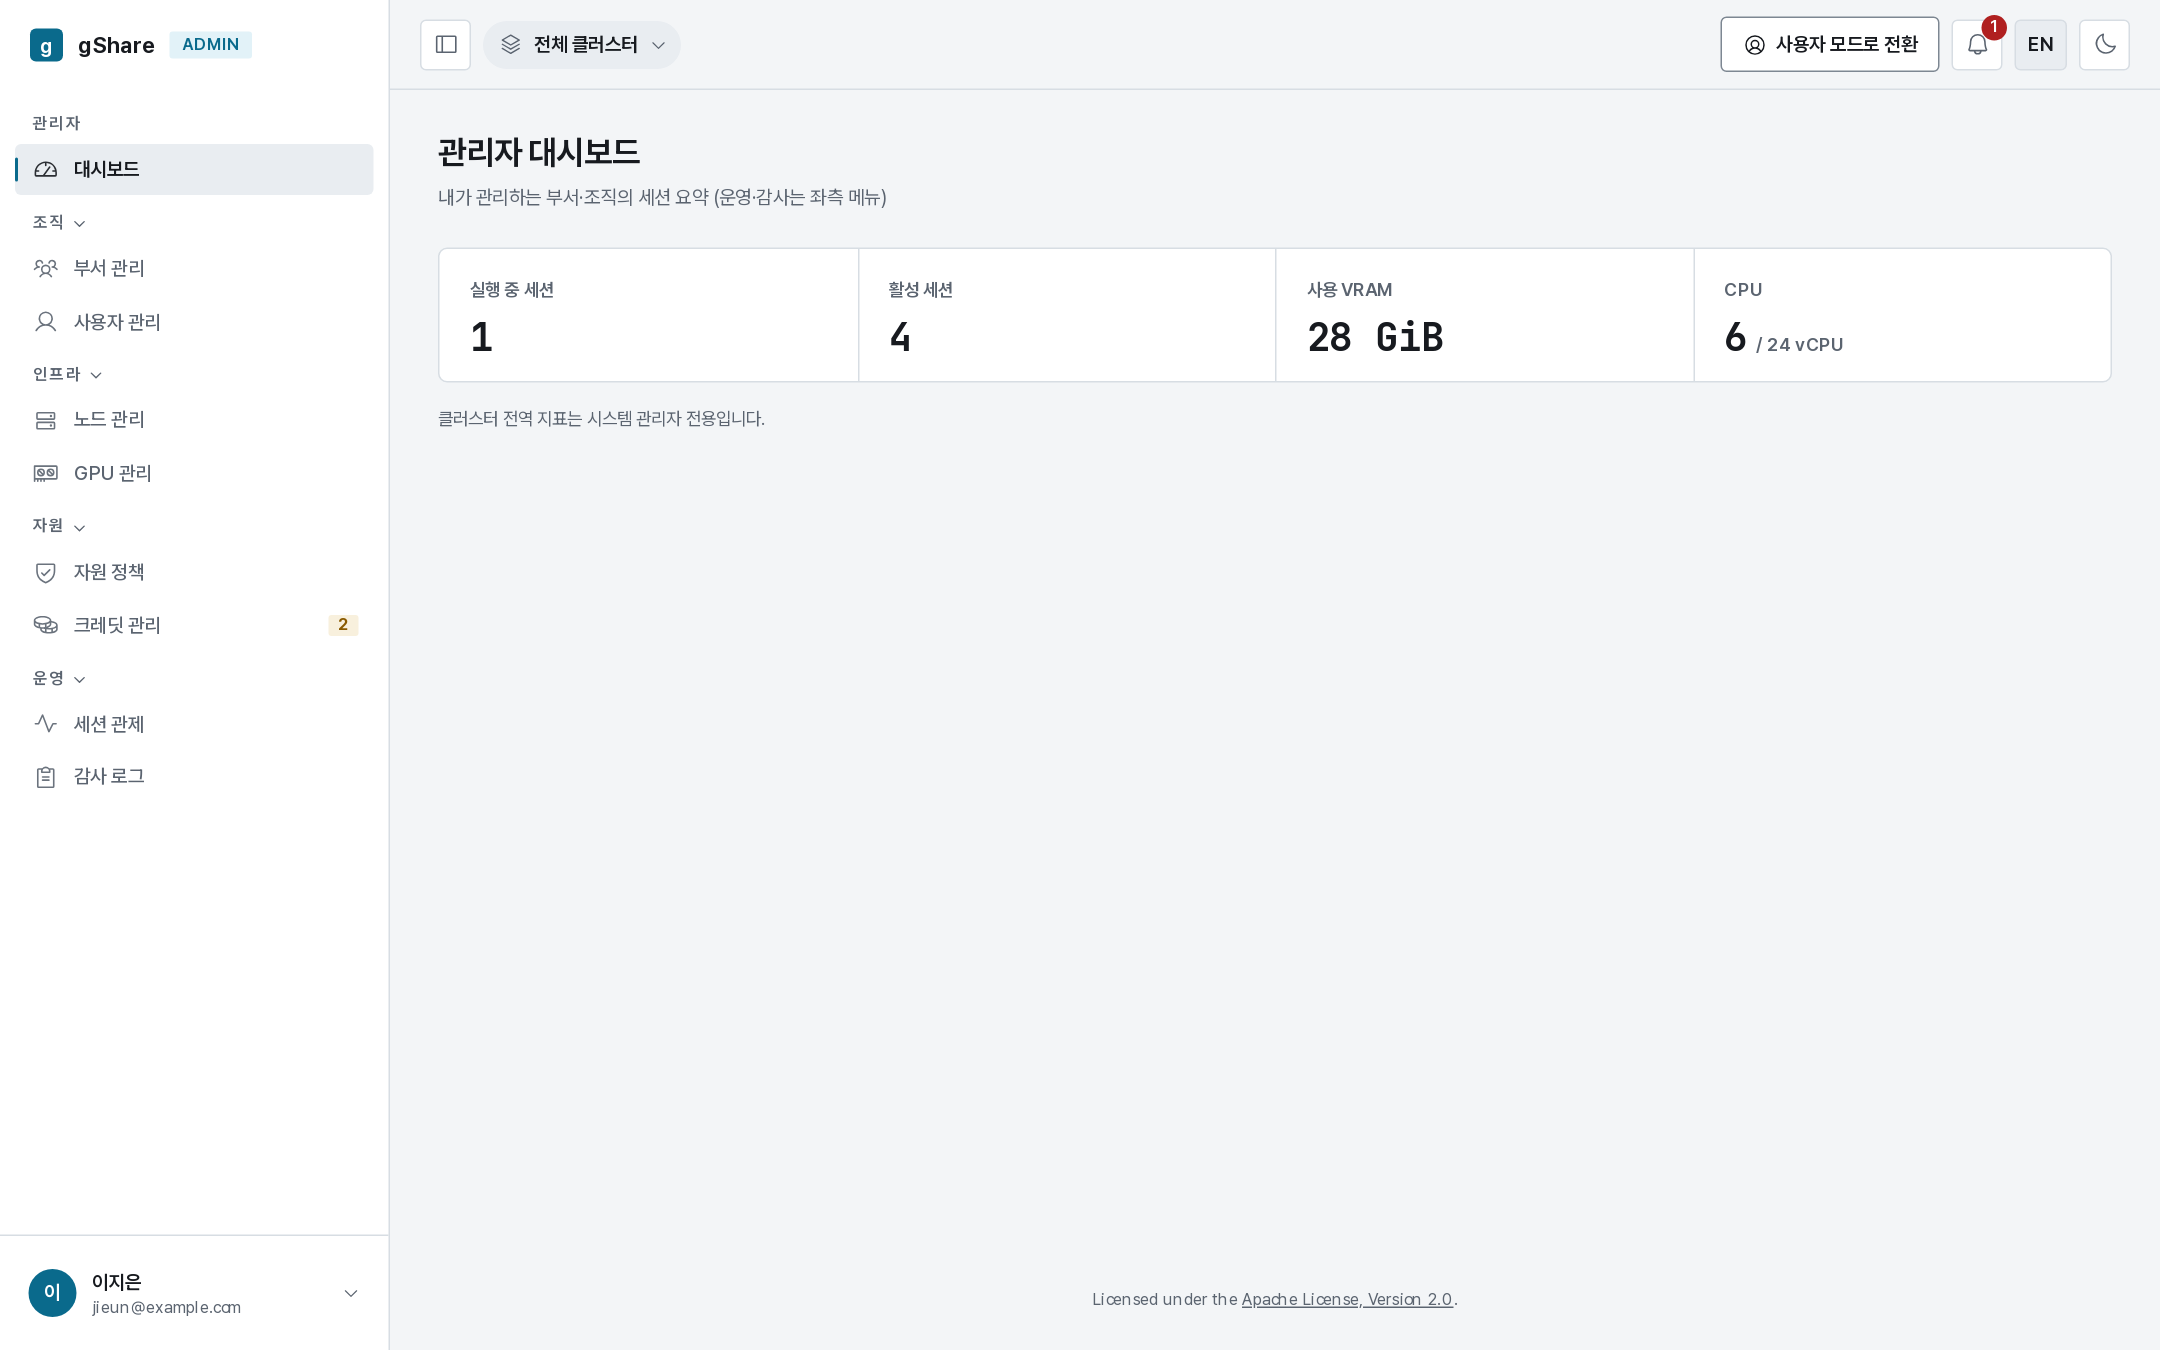
Four tiles, summed over the people you manage — every member of your groups, or for an org_admin every group of the organization — and never over other tenants: running sessions, active sessions, the VRAM those sessions hold, and the CPU they occupy against the fleet. The sessions themselves are on the monitor, credits on the allocation page.
Cluster-wide figures — fleet utilization, node health, storage — are deliberately super_admin only: a tenant administrator manages people, not machines.
As the platform administrator
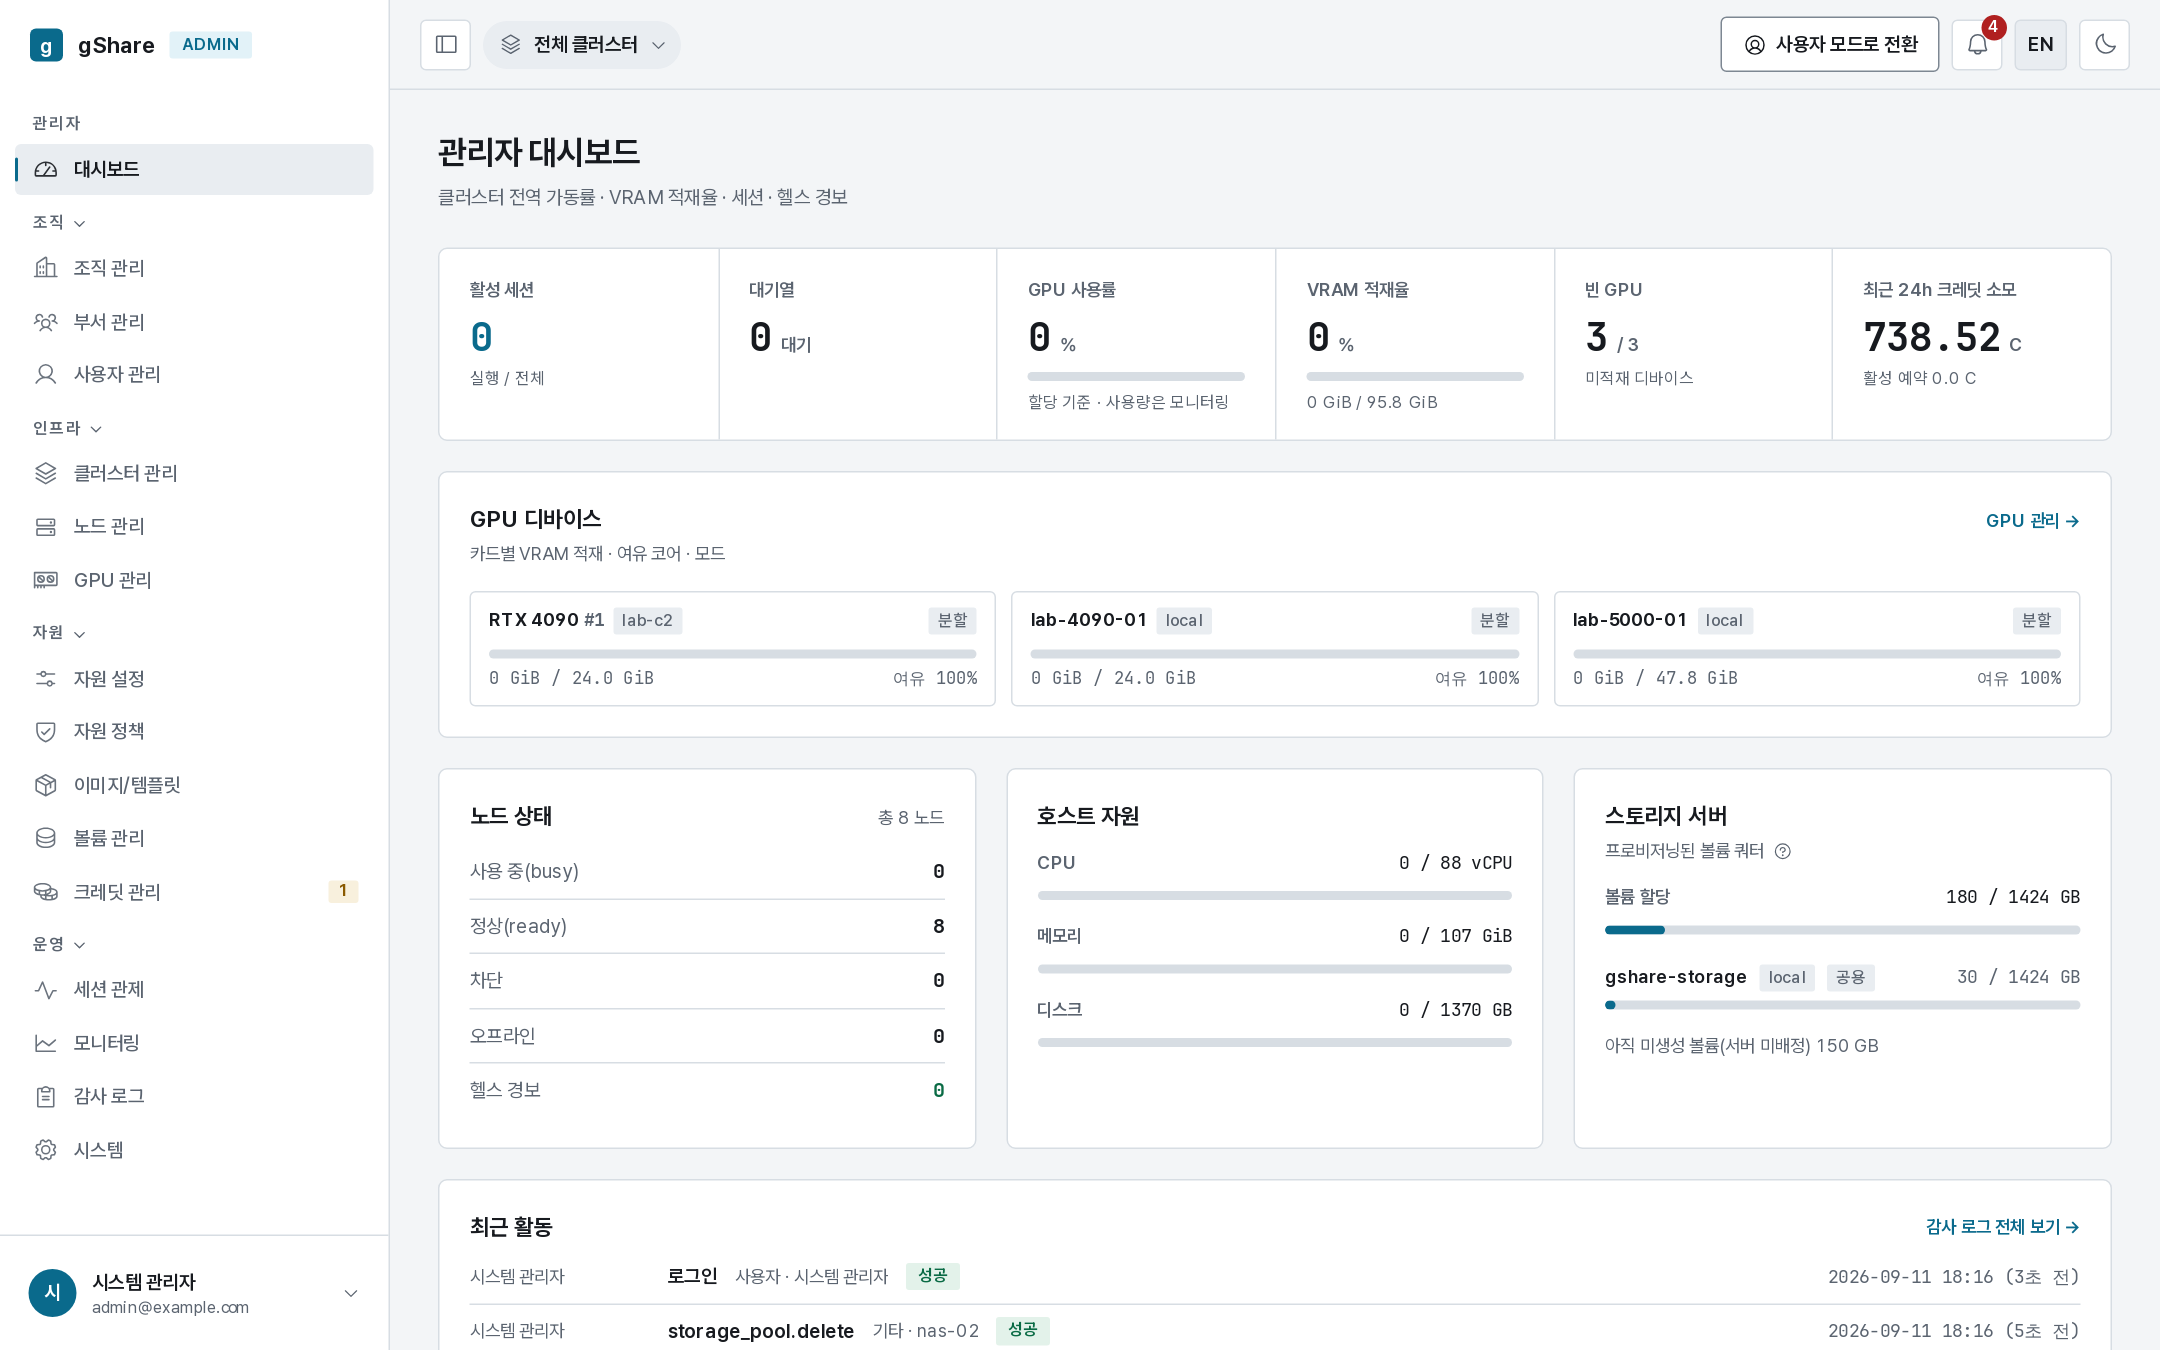
| Panel | What it answers |
|---|---|
| Active sessions · Queue | Is anything waiting, and how much is running |
| GPU utilization · VRAM occupancy | Allocation against real usage — a fleet allocated to 90% but used at 20% is a policy problem, not a capacity one |
| Empty GPUs | Cards with nothing on them right now |
| Credits in the last 24h | Spend rate across the platform, with active holds |
| GPU devices | One tile per card: cluster tag, mode, VRAM occupancy, free cores |
| Node status | Busy, ready, cordoned, offline, open health alerts |
| Host resources | CPU, memory and disk across the fleet |
| Storage server | Provisioned volume quota against the capacity of every registered pool added up, then one row per pool with its own allocation, cluster and sharing |
| Recent activity | The latest audit entries, fleet-wide |
The cluster selector in the top bar narrows every figure to one cluster. The storage panel says shared across clusters when the pool is not any one cluster's own.
Where to go next
The dashboard is a starting point, not a control panel. What you actually do lives one click away: session monitoring for what is running now, credits for who may spend what, nodes for the machines.