Metrics and utilization
Operations → Monitoring charts what the hardware is actually doing, from DCGM and node-exporter through Prometheus. It is the counterpart to the allocation figures everywhere else in the console.
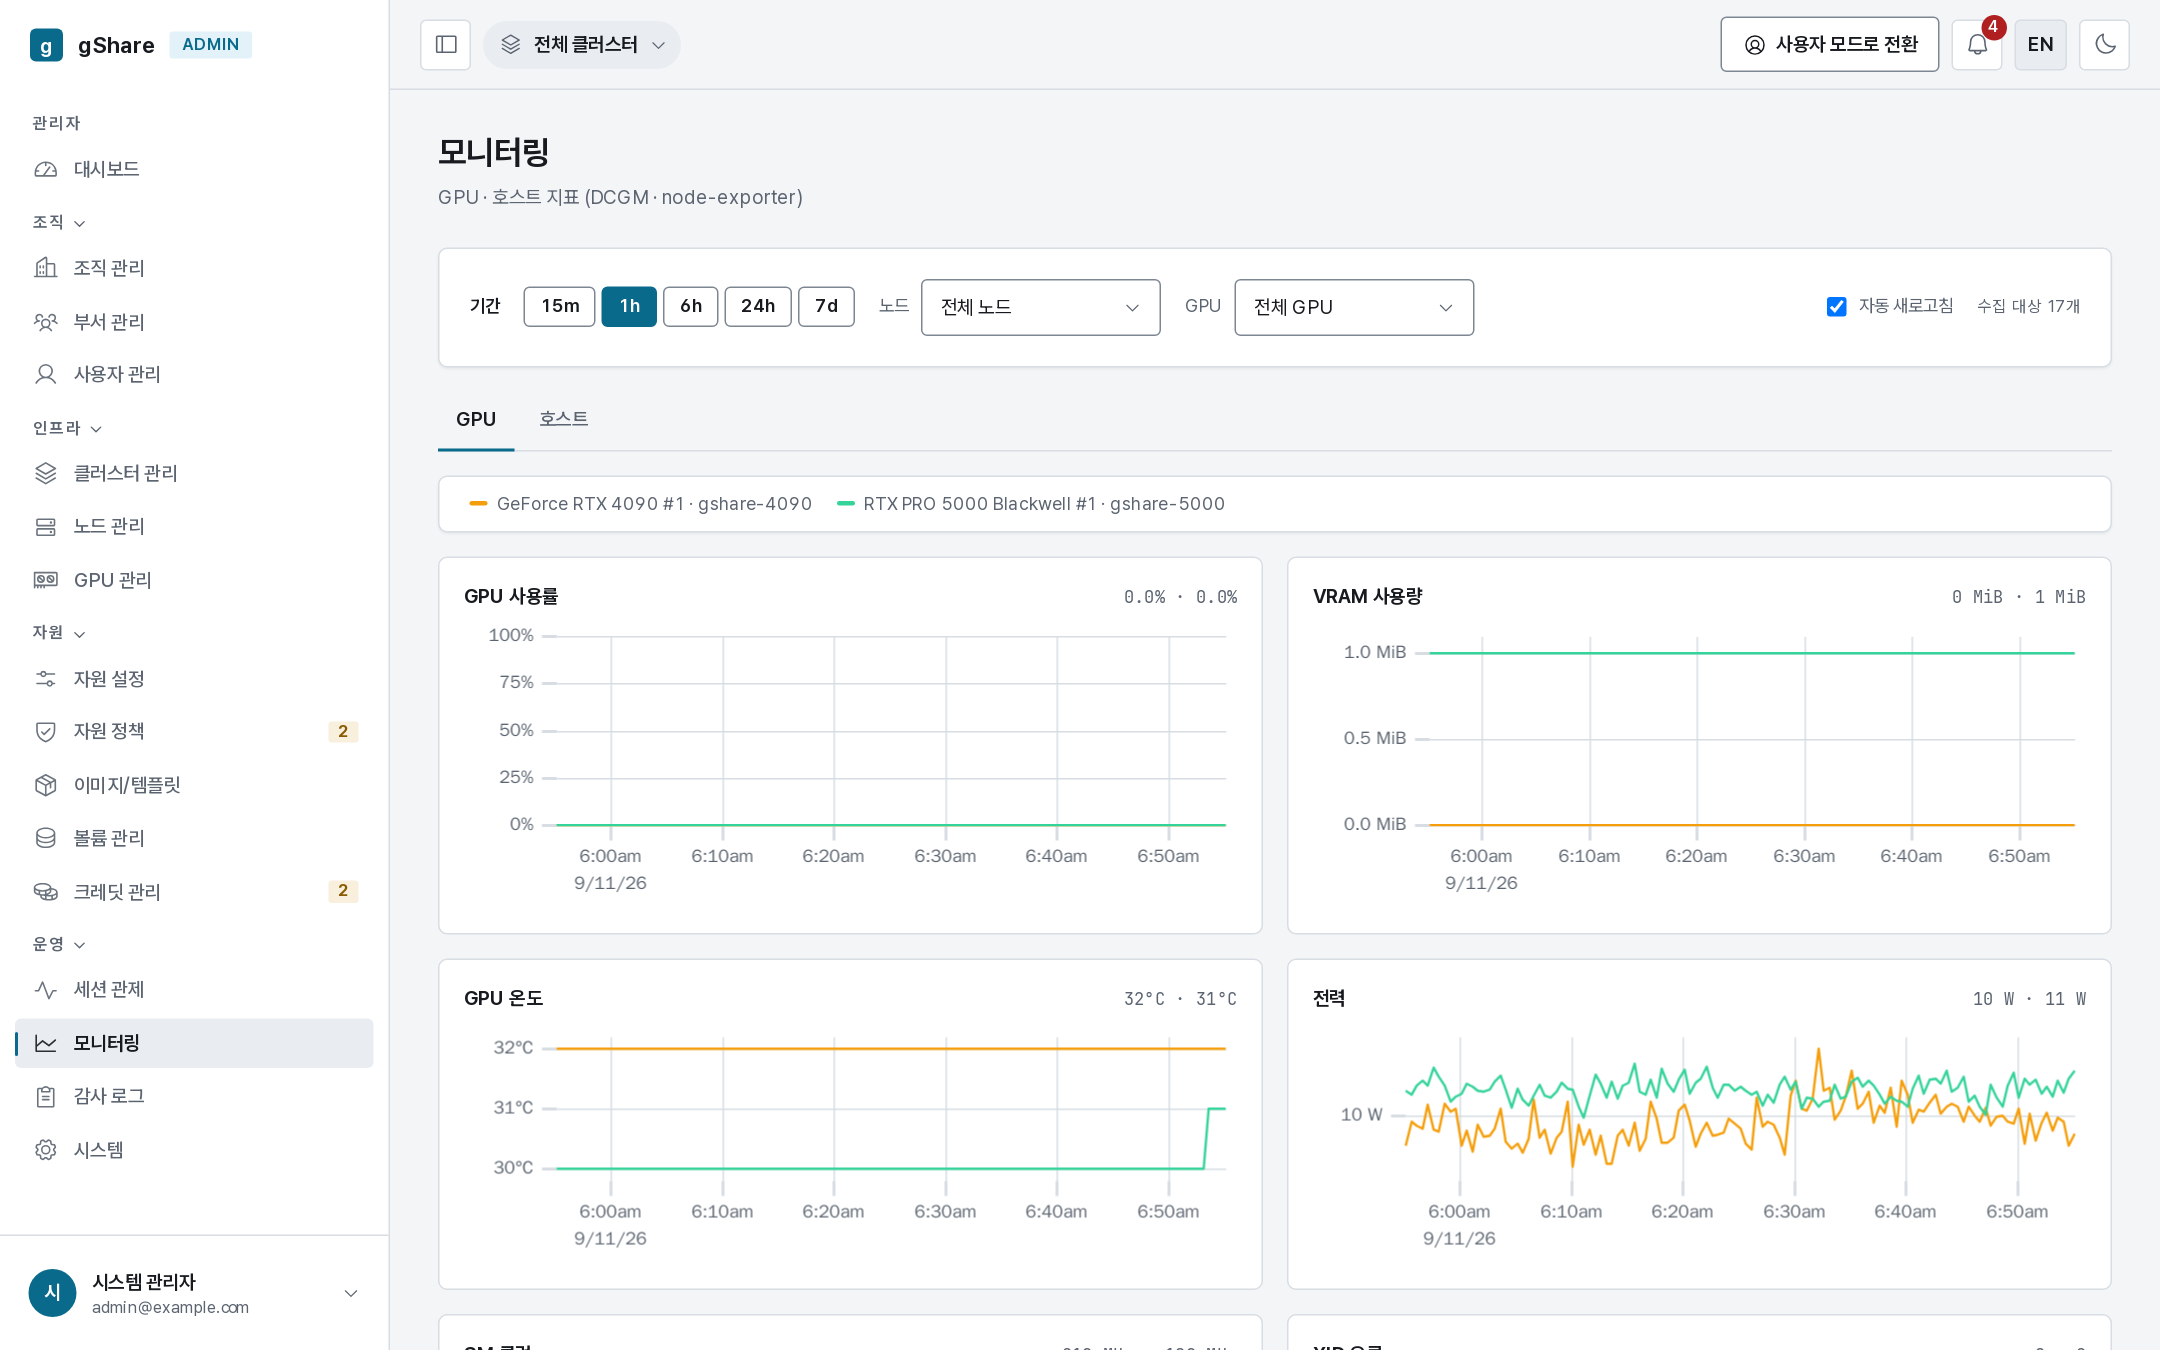
| Tab | What it shows |
|---|---|
| GPU | Per-card utilization, VRAM in use, temperature and power, by node and by card |
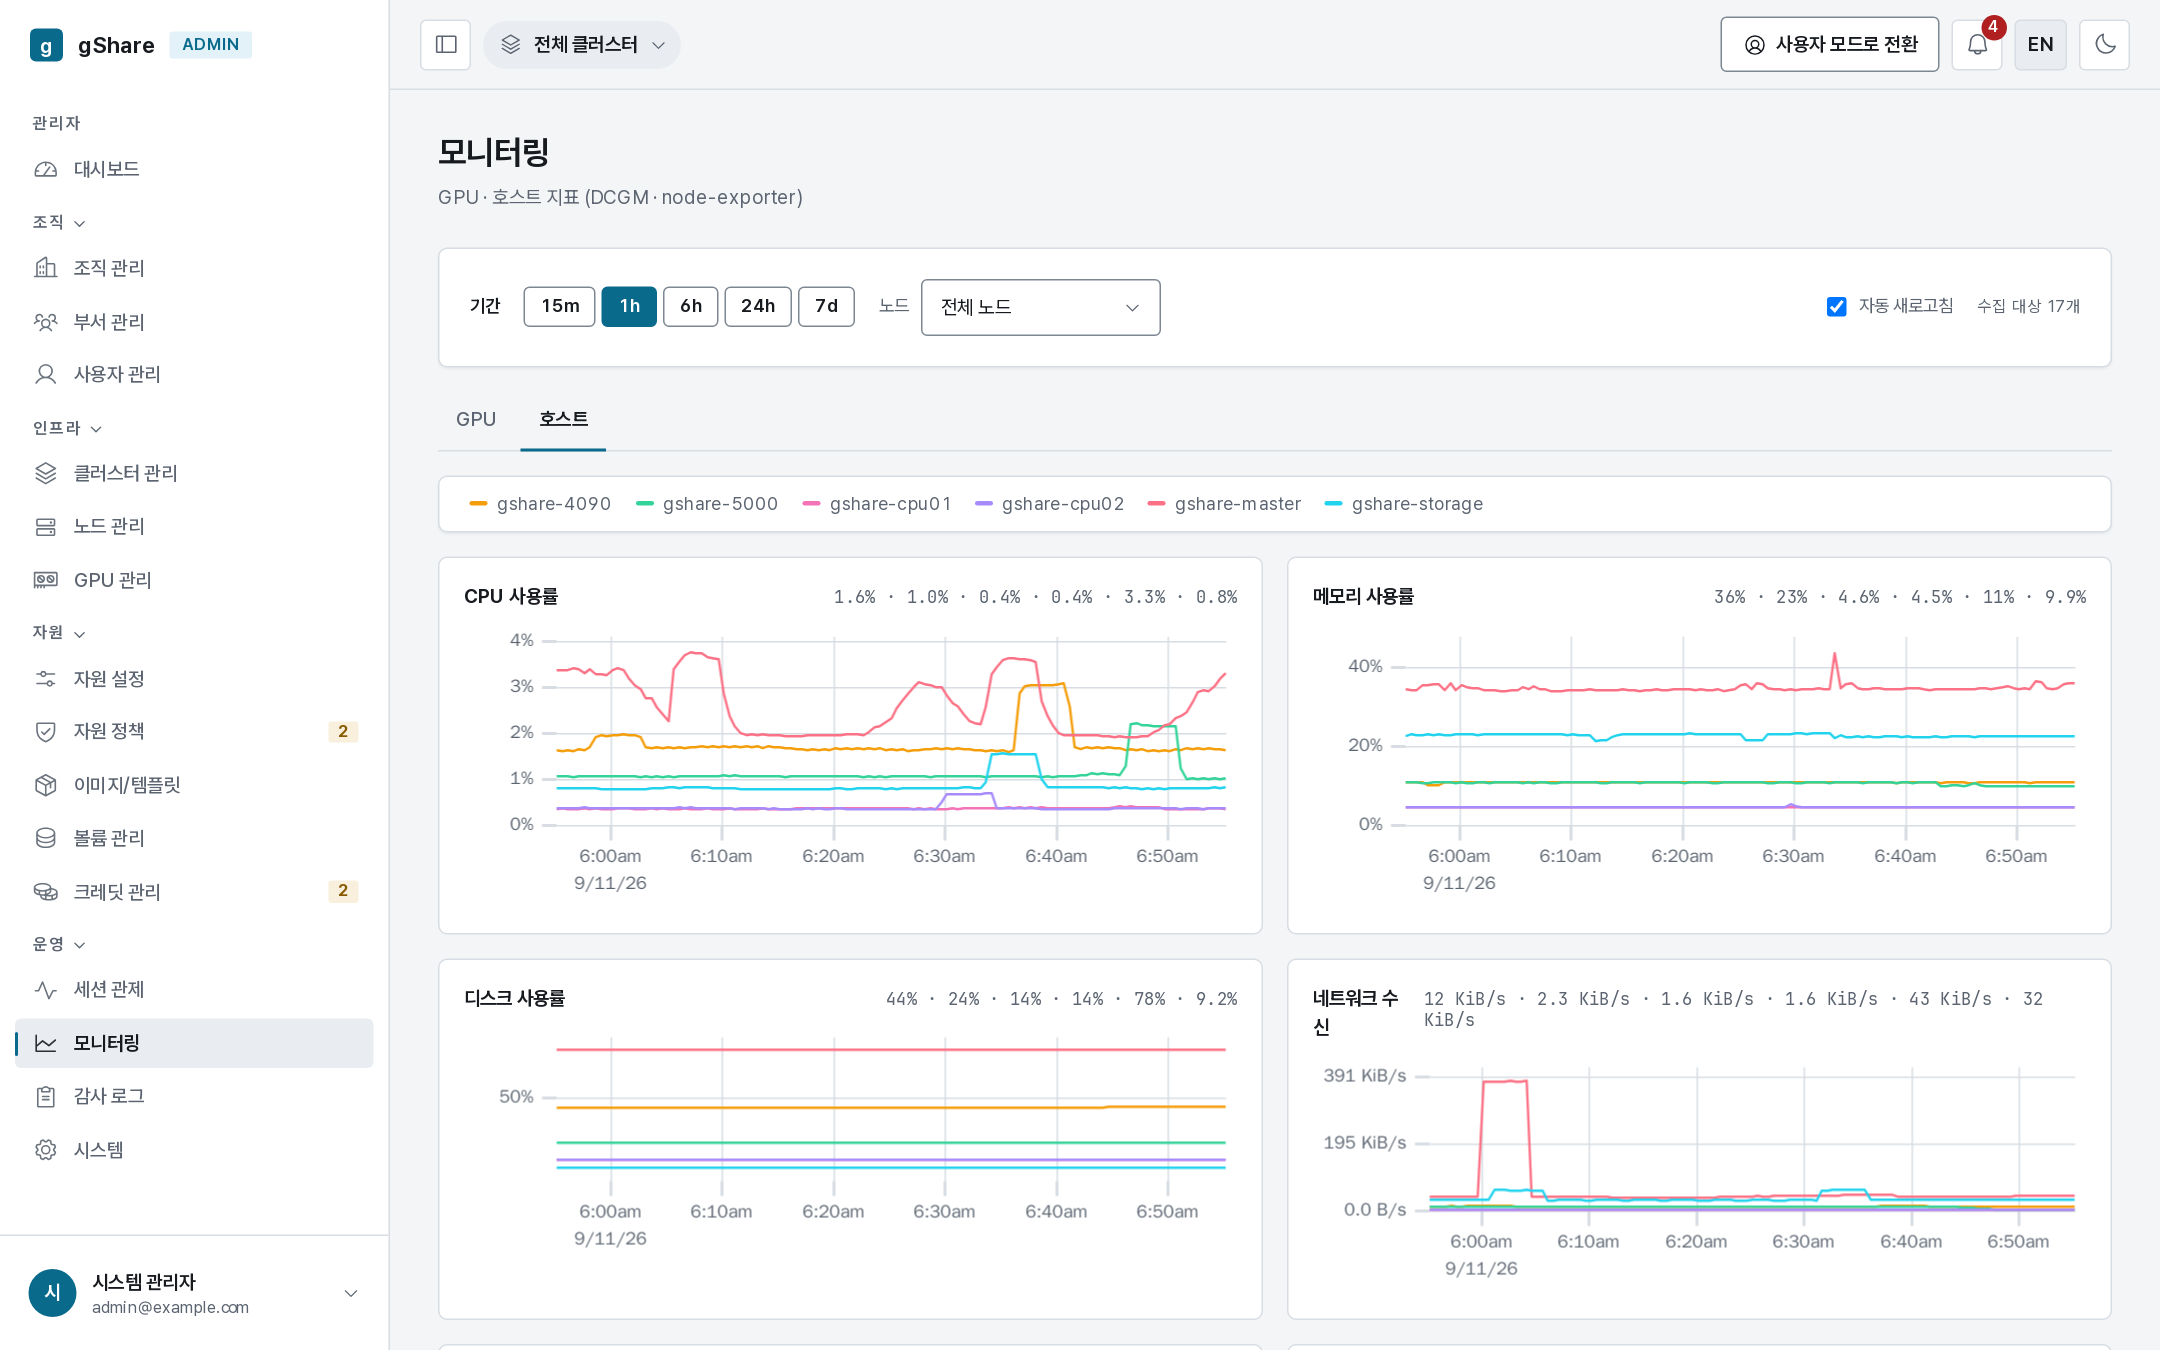
| Host | CPU, memory, disk and network per node |
The range selector and auto-refresh sit at the top; the node filter narrows to one machine.
Allocation versus usage
The table under the charts is the reconciliation that matters:
the graph is what the card is really doing; the table is what the control plane has allocated.
A fractional card cannot be attributed to one session from the graph alone — several sessions share it — which is why both views exist. The pattern to look for:
| Allocation | Utilization | Means |
|---|---|---|
| High | High | Genuinely full. Buy hardware or tighten quotas |
| High | Low | Idle reservations. Shorten the idle timeout, offer smaller tiers |
| Low | High | A few heavy users on exclusive cards; consider pricing or pool policy |
When the page is empty
Metrics need the monitoring stack: make deploy-monitoring installs Prometheus with the dcgm,
node and kube-state exporters. Without it the console says the metrics backend is unreachable,
and — more importantly — the idle reaper has no utilization source unless
operator.hamiMonitorUrl or operator.prometheusUrl is set.
Details, including what each exporter provides, are in Operations → Observability.
Prometheus is never exposed outside the cluster: the console reads it through gshare-api,
which whitelists the queries and enforces the super_admin gate.