Dashboard
The dashboard is the first screen after signing in: your credit balance, how fast you are spending it, your active sessions, and what GPU capacity is free right now.
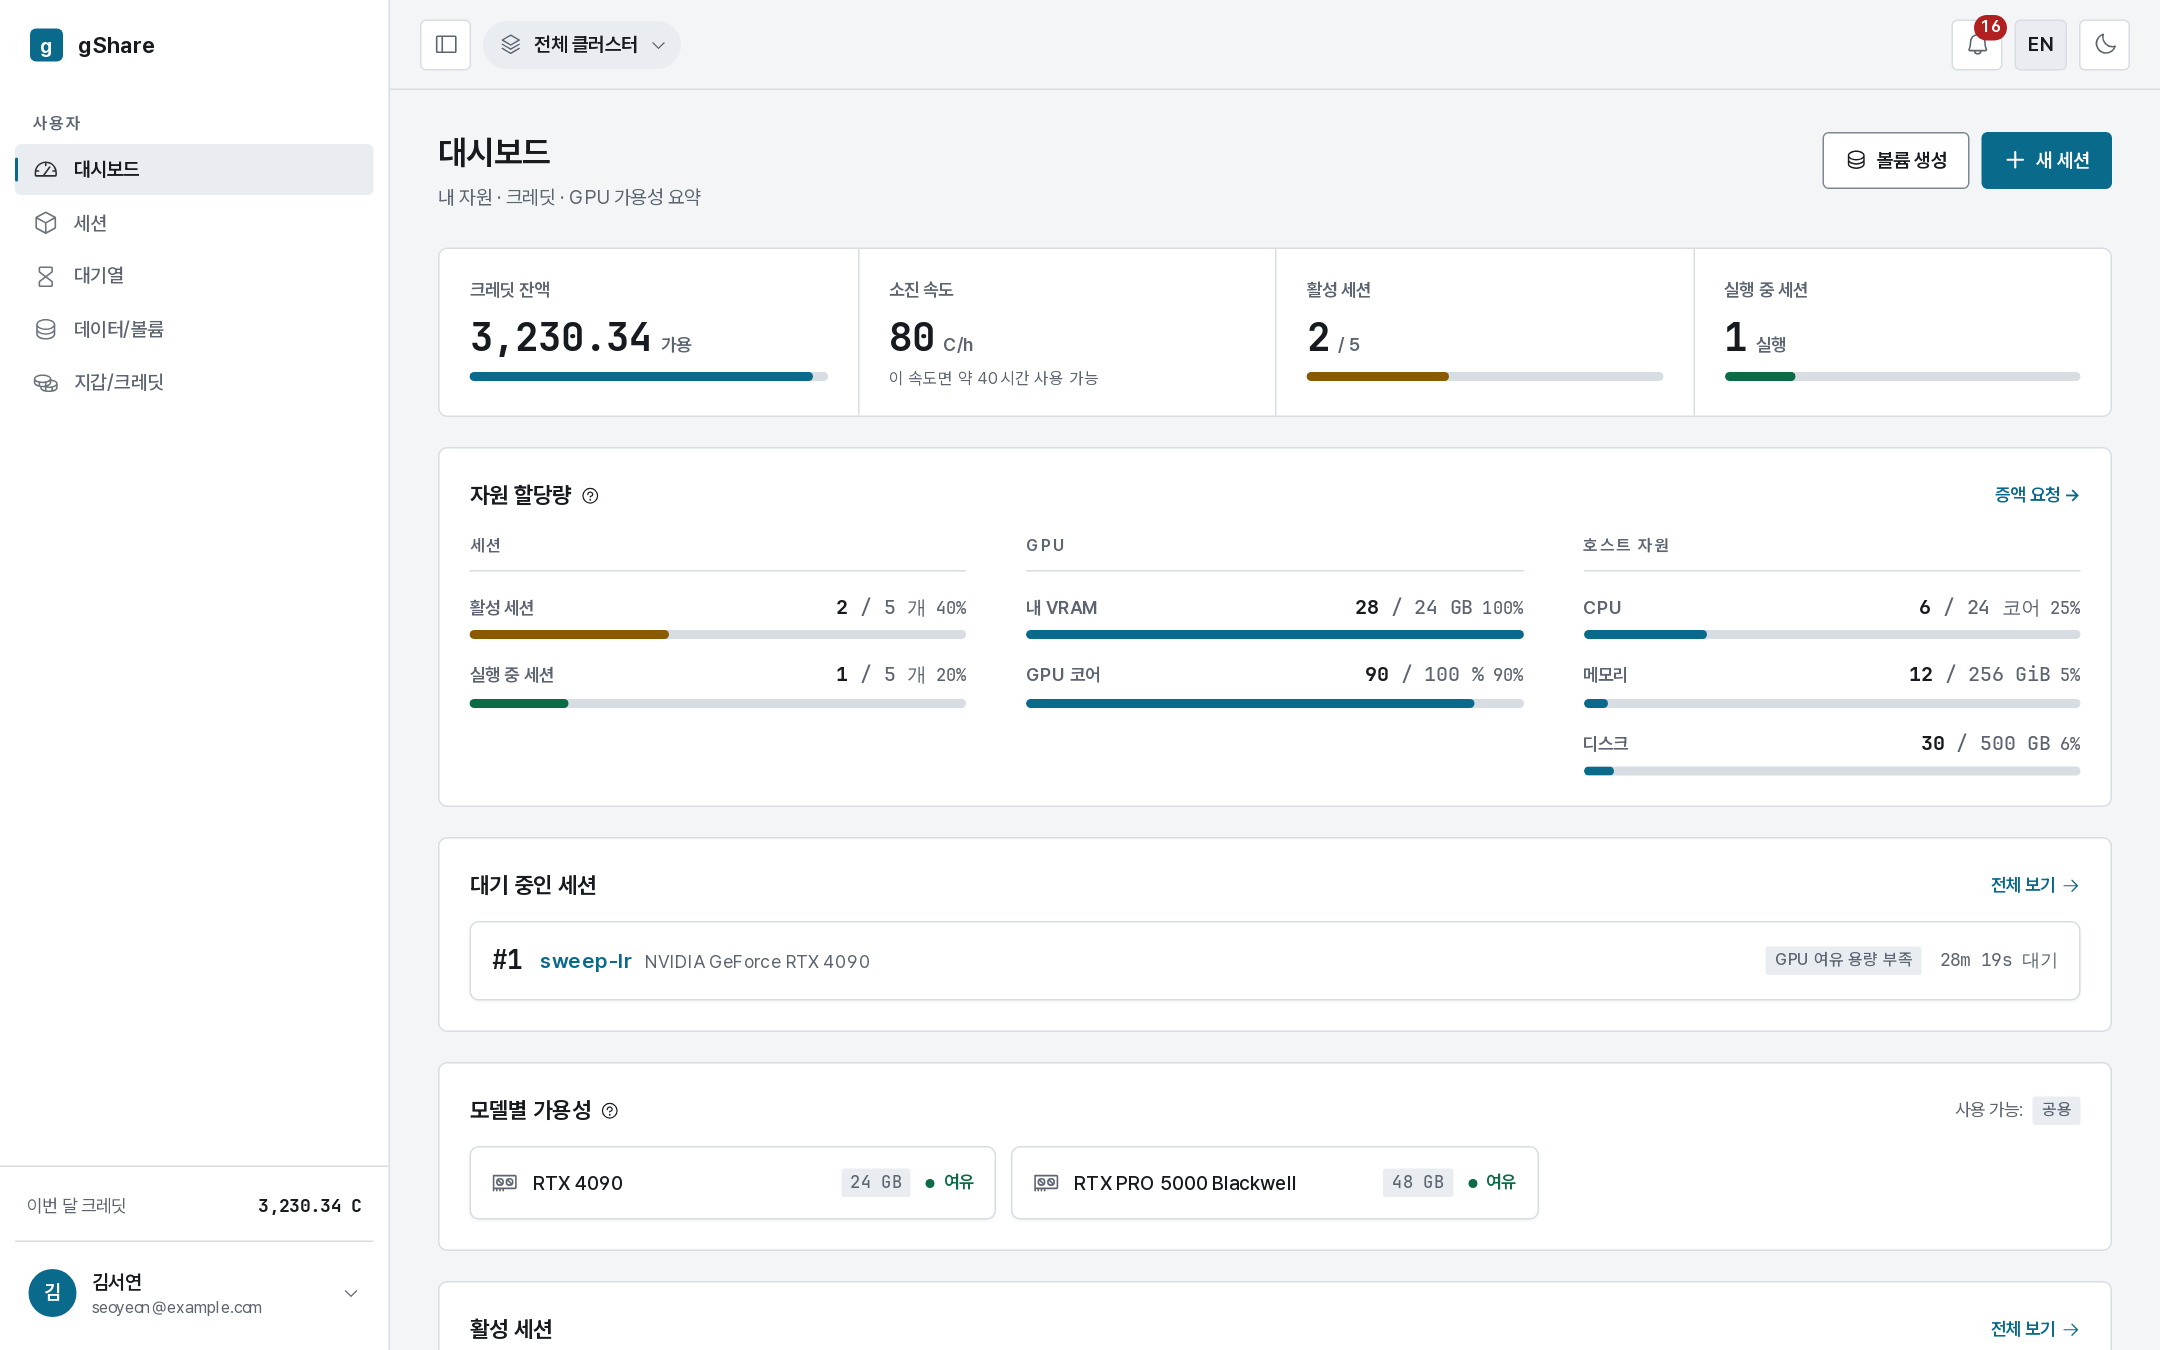
The four tiles
| Tile | What it shows |
|---|---|
| Credit balance | Credits available in your personal wallet, and the bar against this month's starting balance. |
| Burn rate | Credits per hour your running GPU sessions are consuming, and how long the balance lasts at that rate. |
| Active sessions | Sessions that are running, paused, or waiting, against your policy's concurrency limit. |
| Running sessions | Sessions that hold a GPU right now. |
Only GPU sessions cost credits. CPU sessions and volumes are free, so the burn rate is zero whenever no GPU session is running.
Resource allocation
The Resource allocation panel compares what you are using with the limits your resource policy grants: session counts, VRAM and GPU cores, and host CPU, memory, and disk. A bar that is nearly full explains why a new session is refused with quota exceeded. The Request increase link opens a quota request that your administrator reviews.
Availability by model
Each card is one GPU model in the fleet you can use, with its VRAM and whether a slice is free now. This is the same information the session wizard uses when it estimates whether your session starts at once or waits in the queue.
Waiting sessions
When one of your sessions is in the queue, a panel lists it with its position, the reason it is waiting, and how long it has waited — the same information as the queue page, one click closer.
Active and recent sessions
The bottom of the page lists your active sessions (with a link to each) and your recent history, plus a Storage summary of the volumes you own. Everything here links into the full Sessions and Data pages.